Reduction in local bus journeys in England
% decrease in passenger journeys from 2010 to 2025
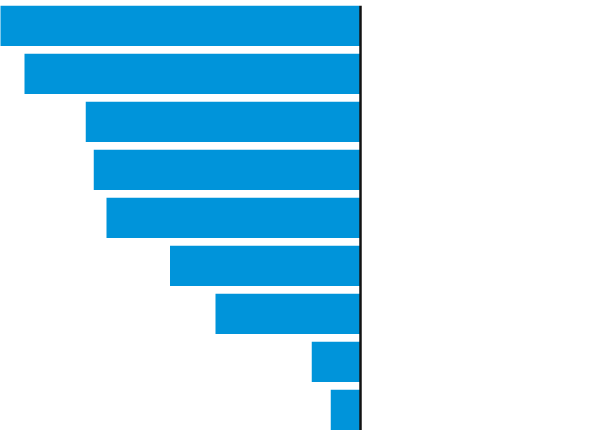
Yorks and Humber
−35.2
North-east
−32.8
North-west
−26.8
West Midlands
−26.1
East Midlands
−24.8
London
−18.6
East of England
−14.2
South-west
−4.8
South-east
−2.9
Yorks and Humber
−35.2
North-east
−32.8
North-west
−26.8
West Midlands
−26.1
East Midlands
−24.8
London
−18.6
East of England
−14.2
South-west
−4.8
South-east
−2.9

Yorks and Humber
−35.2
North-east
−32.8
North-west
−26.8
West Midlands
−26.1
East Midlands
−24.8
London
−18.6
East of England
−14.2
South-west
−4.8
South-east
−2.9

Yorks and Humber
−35.2
North-east
−32.8
North-west
−26.8
West Midlands
−26.1
East Midlands
−24.8
London
−18.6
East of England
−14.2
South-west
−4.8
South-east
−2.9
Yorks and Humber
−35.2
North-east
−32.8
North-west
−26.8
West Midlands
−26.1
East Midlands
−24.8
London
−18.6
East of England
−14.2
South-west
−4.8
South-east
−2.9

Yorks and Humber
−35.2
North-east
−32.8
North-west
−26.8
West Midlands
−26.1
East Midlands
−24.8
London
−18.6
East of England
−14.2
South-west
−4.8
South-east
−2.9

Yorks and Humber
−35.2
North-east
−32.8
North-west
−26.8
West Midlands
−26.1
East Midlands
−24.8
London
−18.6
East of England
−14.2
South-west
−4.8
South-east
−2.9

Yorks and Humber
−35.2
North-east
−32.8
North-west
−26.8
West Midlands
−26.1
East Midlands
−24.8
London
−18.6
East of England
−14.2
South-west
−4.8
South-east
−2.9