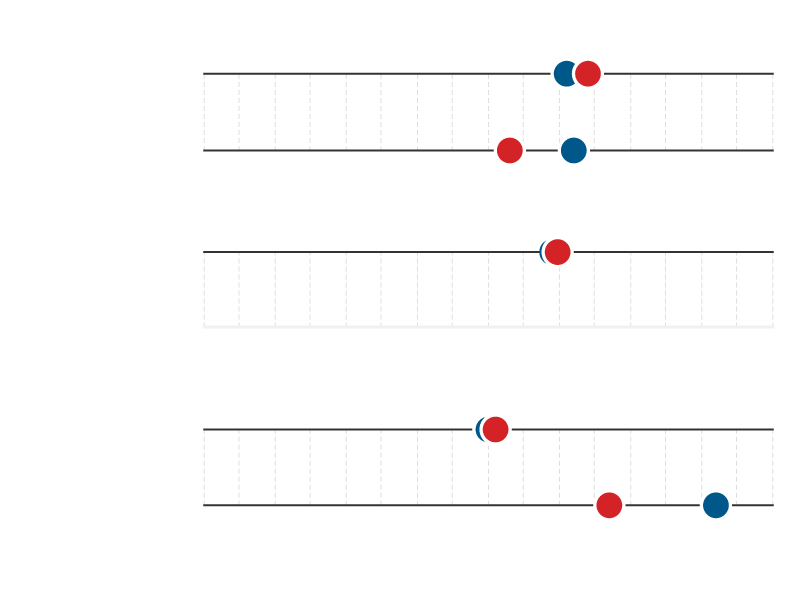
Candidate support by demographic
Who would you most like to see win your party's nomination for president?*
Clinton● Trump●

10
30
40
60
20
50
70
80
Men
Women
White
Non-white
Not applicable
Under 55
55 & older
10
30
40
60
20
50
70
80

10
30
40
60
20
50
70
80
Men
Women
White
Non-white
Not applicable
Under 55
55 & older
10
30
40
60
20
50
70
80
10
30
40
60
20
50
70
80
Men
Women
White
Non-white
Not applicable
Under 55
55 & older
10
30
40
60
20
50
70
80
Source: CNN/ORC poll. April 28 - May 1, 2016. N 890, ± 3.5 percentage points. | *Note: Numbers for Clinton are among registered Democrats. Trump's numbers are among registered Republicans.
Graphic: Jan Diehm/The Guardian
Graphic: Jan Diehm/The Guardian