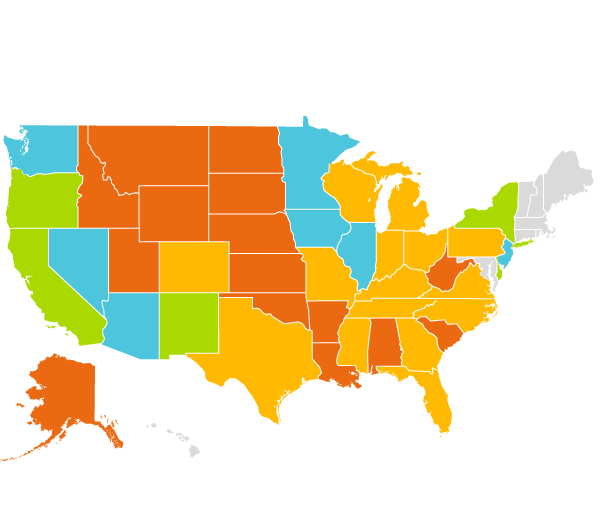
US environmental scorecard

The report looked at voting records from 1990 to 2014
Each state’s carbon emissions in 2014
0-19% | 20-39% | 40-59%
60-79% | 80-100%
Alaska

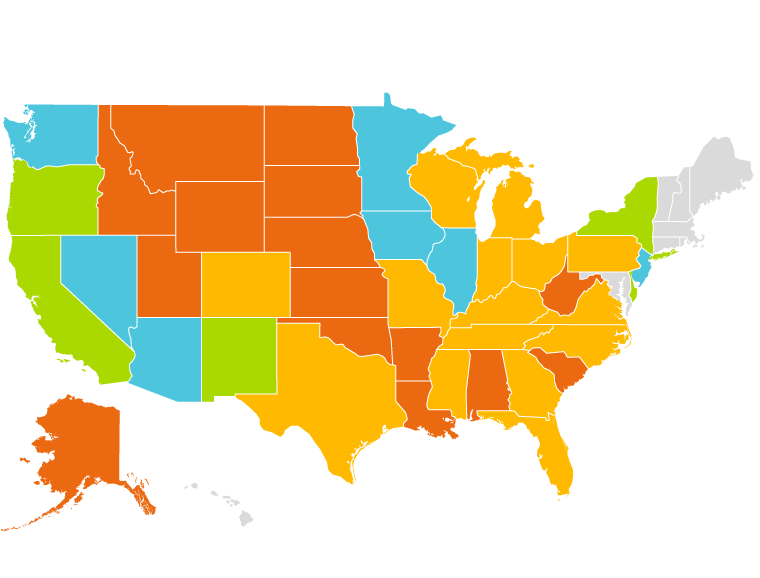
Note: The report looked at voting records from 1990 to 2014
Each state’s carbon emissions in 2014
0-19% | 20-39% | 40-59% | 60-79% | 80-100%
Alaska

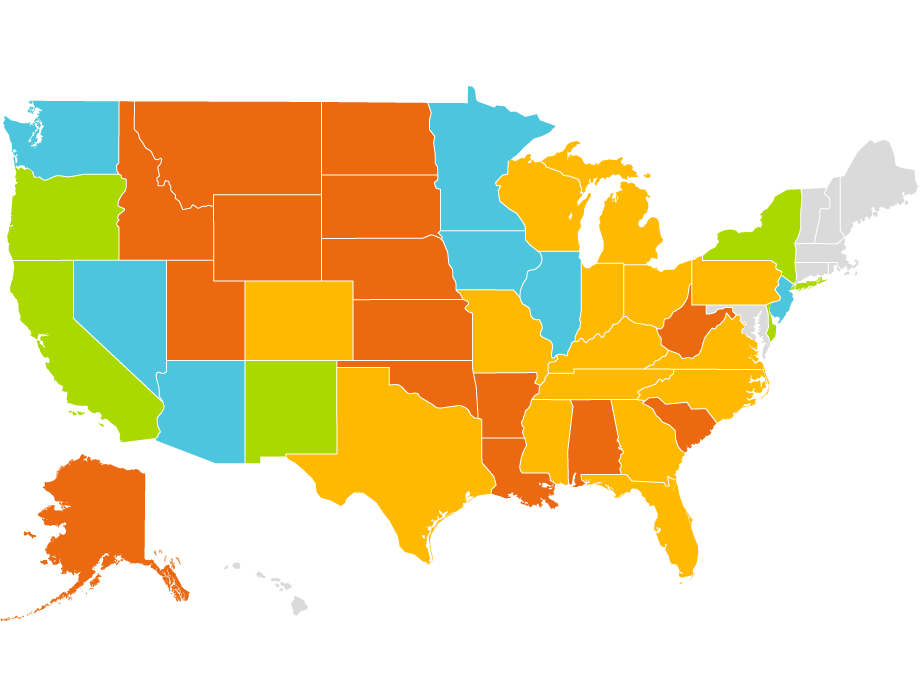
Note: The report looked at voting records from 1990 to 2014
Each state’s carbon emissions in 2014
0-19% | 20-39% | 40-59% | 60-79% | 80-100%
Alaska

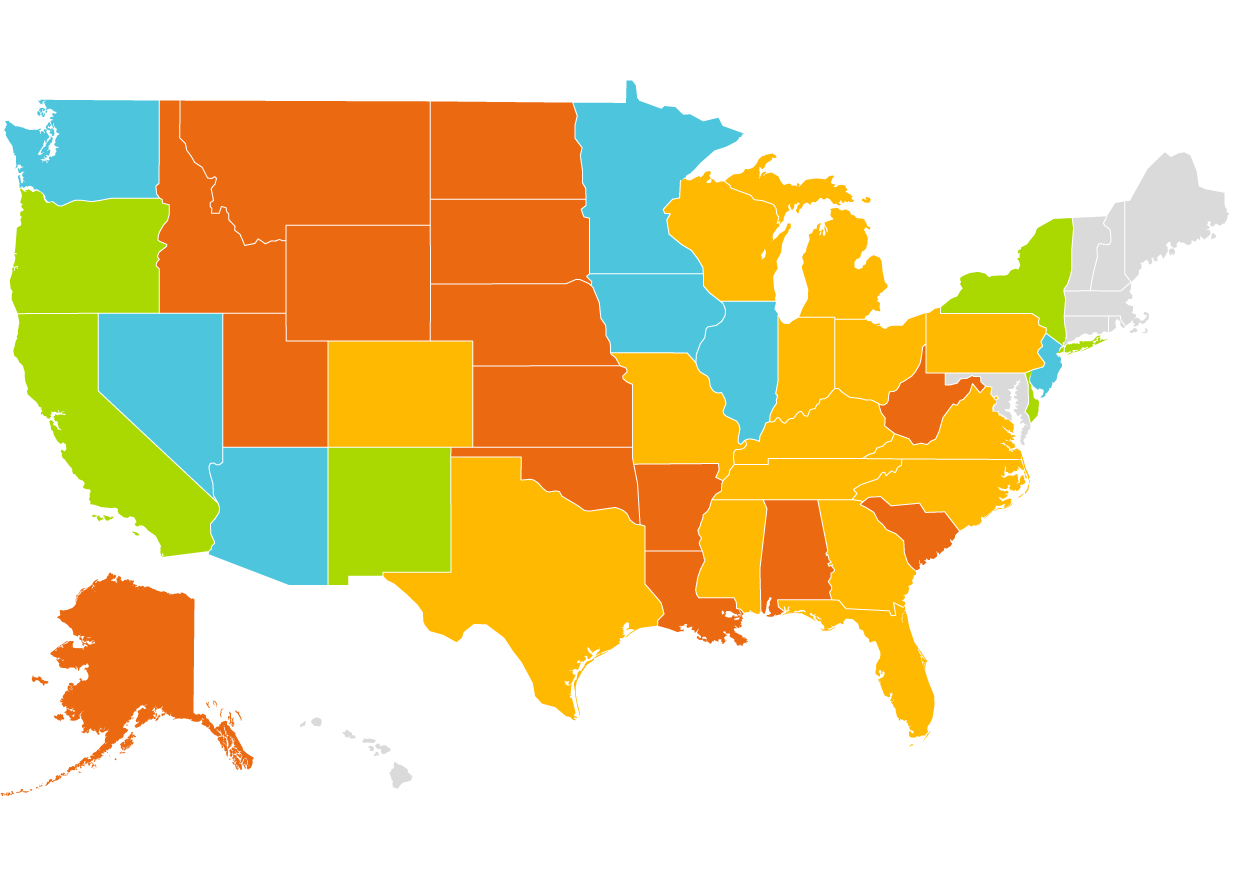
Note: The report looked at voting records from 1990 to 2014
Each state’s carbon emissions in 2014
0-19% | 20-39% | 40-59% | 60-79% | 80-100%
Alaska