General living expenses 29%
Re-invest in ISA’s 23%
Holiday 19%
Home improvements 18%
Undecided 18%
Pay off mortgage 14%
Give to family/children 10%
New car 10%
Buy to let property 7%
Personal pension
Earnings and other
income
Other investments
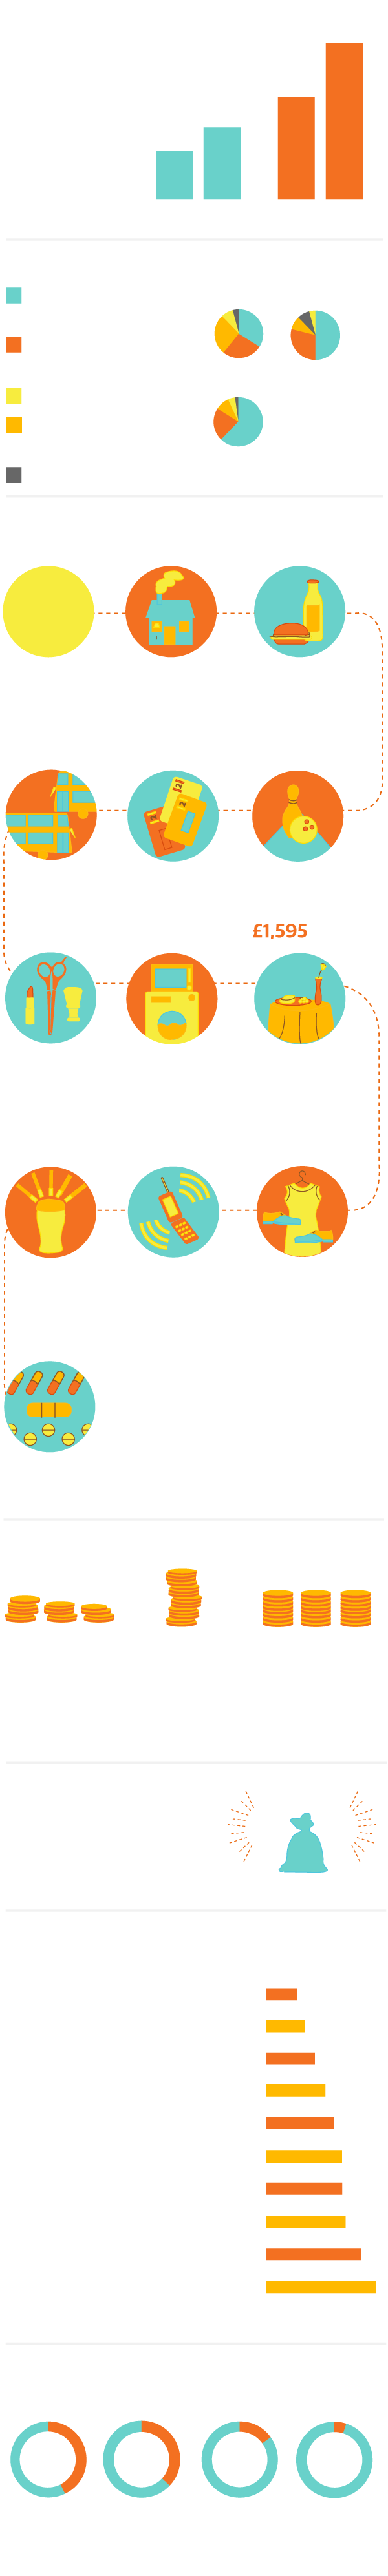
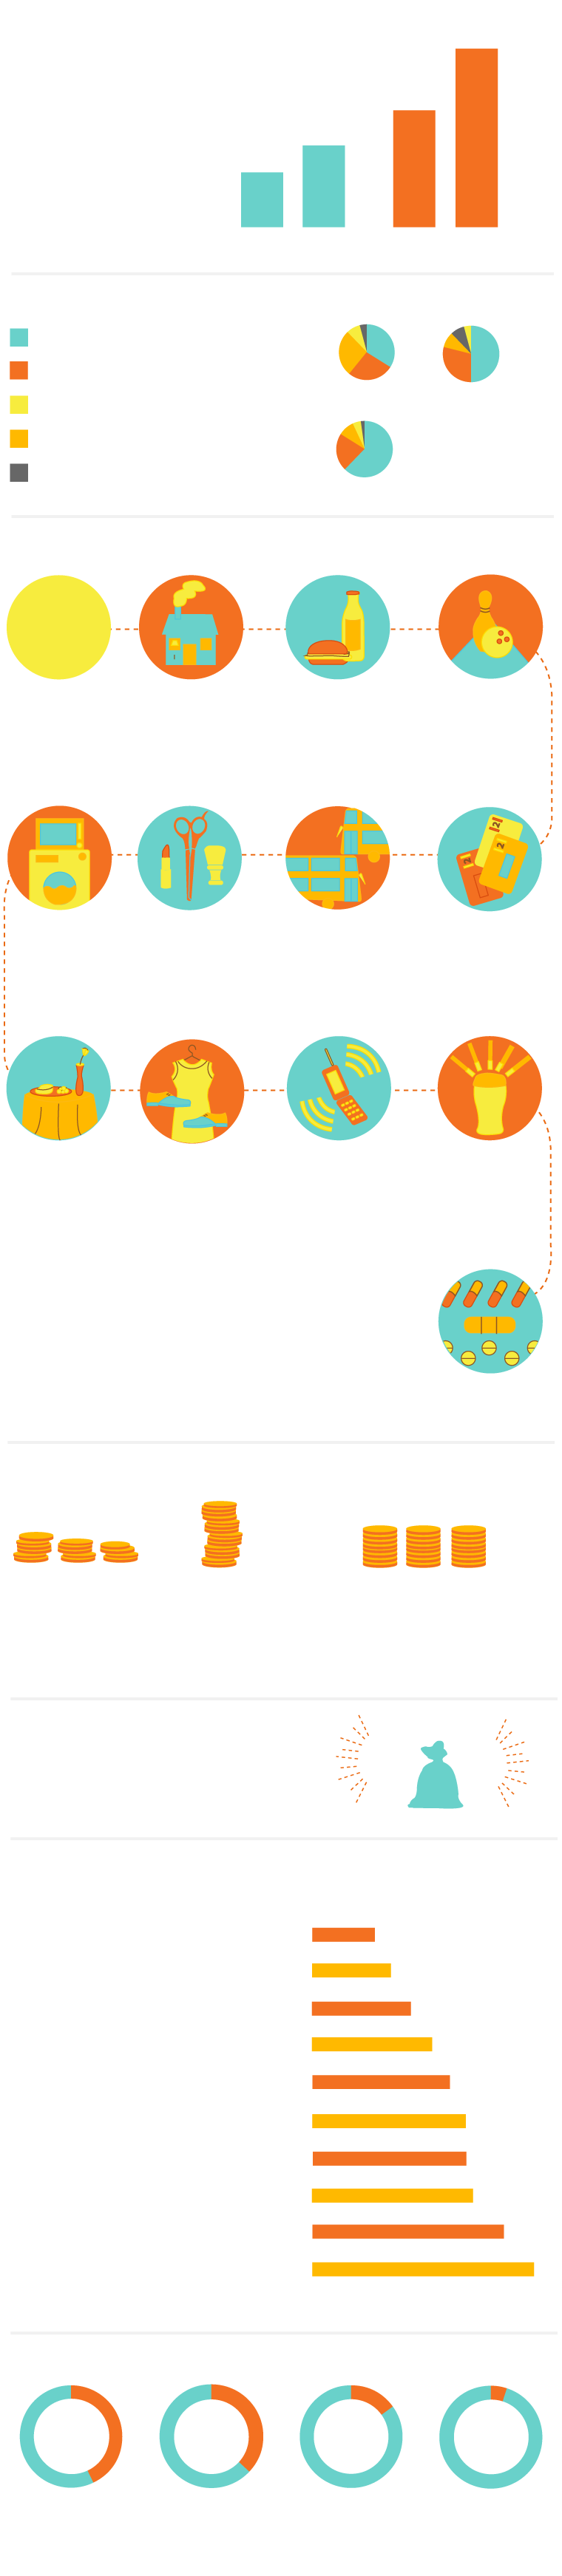
£296
£610
£424
£202
2011
1994
2011
1994
Single pensioners
Pensioner couples
Gross income
per week at
2010-2011
prices
Average pensioner income
Occupational
pension
Benefit (incl. state
pension)
Where do pensioners get their money?
Women
Men
Couples
Household
goods and
services
£862
Transport
£1,240
Personal
care
£897
What pensioners spend their money
on each year
Total
£11,200
Health
£212
Food and
non- alcoholic
drinks
£1,568
Clothing and
footwear
£390
Alcohol
and tobacco
£291
Connection
£352
Restaurants
and hotel
£810
Bills
£1,303
Recreation
and culture
Housing and
utilities
£1,680
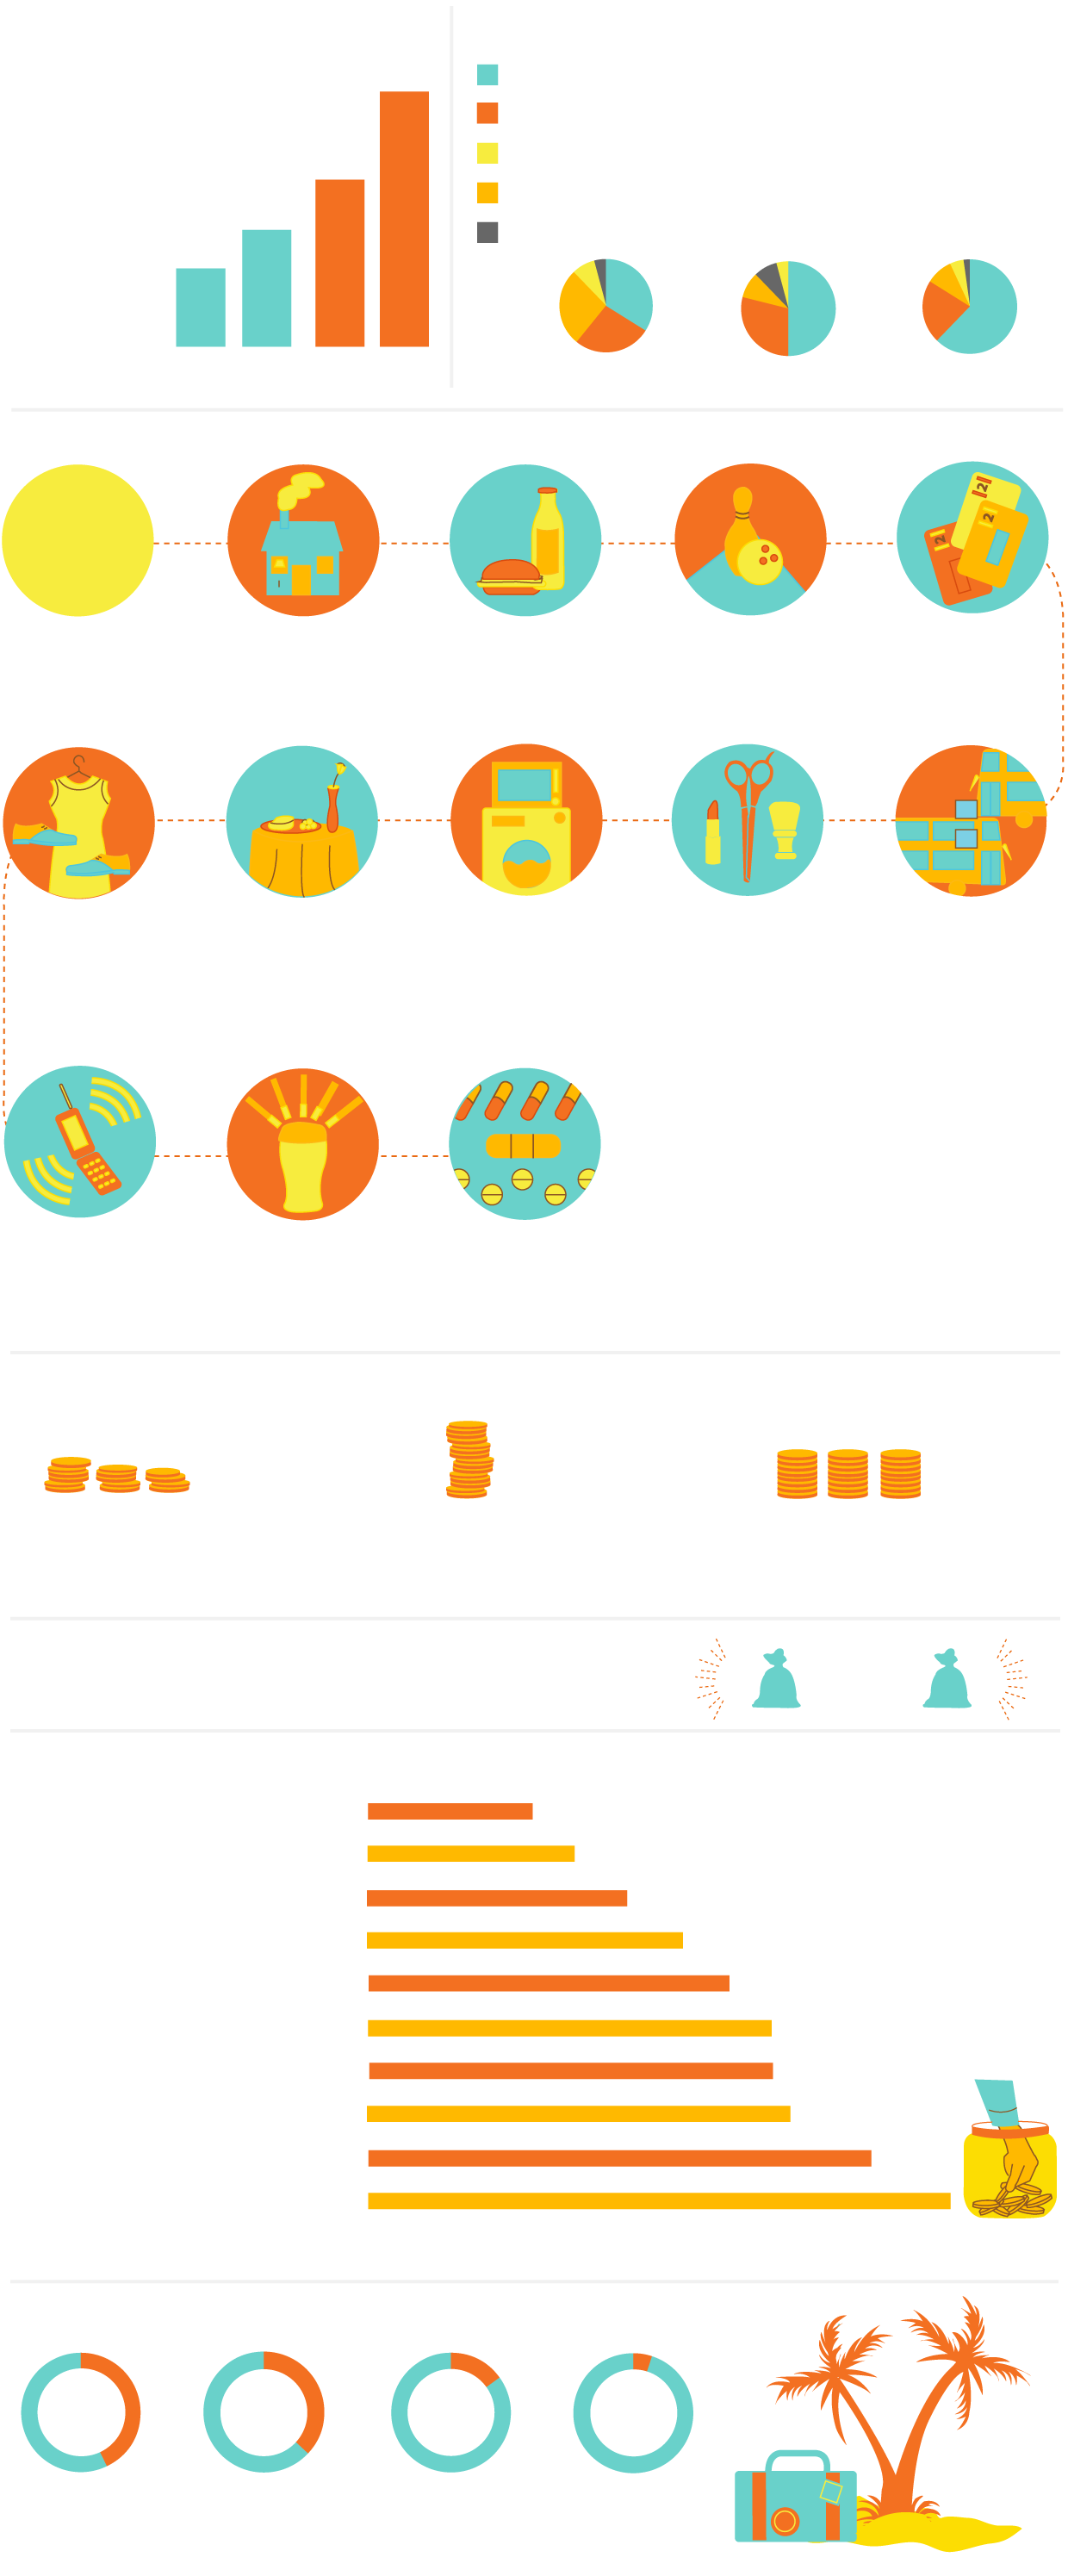
A regular
annual income
of similar
amounts
23%
Take it as
one lump
sum
31%
Take several
smaller
lump sums
46%
What 55+ savers plan to do with their
retirement funds
Respondents could choose more than one
Holiday home 4%
Spending intentions of 55 to 75-year-olds
under new pension freedoms
£
£27,000
Average amount savers
plan to withdraw in a
lump sum from their
retirement fund in
2015/16
5%
43%
less than
£2,000
37%
15%
over
£10,000
£5,000-
£10,000
£2,000-
£5,000
And how much do they plan to splash
out on a holiday
General living expenses 29%
Re-invest in ISA’s 23%
Holiday 19%
Home improvements 18%
Undecided 18%
Pay off mortgage 14%
Give to family/children 10%
New car 10%
Buy to let property 7%
£296
£610
£424
£202
2011
1994
2011
1994
Single pensioners
Pensioner couples
Gross income per
week at 2010-2011
prices
Average pensioner income
Personal pension
Earnings and other income
Other investments
Occupational pension
Benefit (incl. state pension)
Where do pensioners get their money?
Women
Men
Couples
Household
goods and
services
£862
Transport
£1,240
Personal care
£897
What pensioners spend their money on each year
Total
£11,200
Health
£212
Food and non-
alcoholic
drinks
£1,568
Clothing and
footwear
£390
Alcohol
and
tobacco
£291
Connection
£352
Restaurants
and hotel
£810
Bills
£1,303
Recreation
and
culture
£1,595
Housing and
utilities
£1,680
A regular annual
income of similar
amounts
23%
Take it as
one lump
sum
31%
Take several
smaller
lump sums
46%
What 55+ savers plan to do with their retirement funds
Respondents could choose more than one
Holiday home 4%
Spending intentions of 55 to 75-year-olds
under new pension freedoms
£
£27,000
Average amount savers plan to
withdraw in a lump sum from
their retirement fund in 2015/16
5%
43%
less than
£2,000
37%
15%
over
£10,000
£5,000-
£10,000
£2,000-
£5,000
And how much do they plan to splash out on a holiday

General living expenses 29%
Re-invest in ISA’s 23%
Holiday 19%
Home improvements 18%
Undecided 18%
Pay off mortgage 14%
Give to family/children 10%
New car 10%
Buy to let property 7%
£296
£610
£424
£202
2011
1994
2011
1994
Single pensioners
Pensioner couples
Gross income
per week at
2010-2011
prices
Average pensioner income
Personal pension
Earnings and other income
Other investments
Occupational pension
Benefit (incl. state pension)
Where do pensioners get
their money?
Women
Men
Couples
Household
goods and
services
£862
Transport
£1,240
Personal care
£897
What pensioners spend their money on each year
Total
£11,200
Health
£212
Food and
non-alcoholic
drinks
£1,568
Clothing
and
footwear
£390
Alcohol and
tobacco
£291
Connections
£352
Restaurants
and hotel
£810
Bills
£1,303
Recreation
and culture
£1,595
Housing and
utilities
£1,680
A regular annual income
of similar amounts
23%
Take it as one
lump sum
31%
Take several
smaller lump sums
46%
What 55+ savers plan to do with their retirement funds
Respondents could choose more than one
Holiday home 4%
Spending intentions of 55 to 75-year-olds
under new pension freedoms
£
£27,000
Average amount savers plan to withdraw
in a lump sum from their retirement fund in
2015/16
5%
43%
less than
£2,000
37%
15%
over
£10,000
£5,000-
£10,000
£2,000-
£5,000
And how much do they plan to splash out on a holiday
General living expenses 29%
Re-invest in ISA’s 23%
Holiday 19%
Home improvements 18%
Undecided 18%
Pay off mortgage 14%
Give to family/children 10%
New car 10%
Buy to let property 7%
£
£
£27,000
Average amount savers plan to withdraw in a lump sum from their retirement fund in 2015/16
£296
£610
£424
£202
2011
1994
2011
1994
Single pensioners
Pensioner couples
Gross income
per week at
2010-2011
prices
Average pensioner income
Personal pension
Earnings and other income
Other investments
Occupational pension
Benefit (incl. state pension)
Where do pensioners get their money?
Women
Men
Couples
What pensioners spend their money on each year
Household
goods and
services
£862
Transport
£1,240
Personal care
£897
Total
£11,200
Health
£212
Food and non-
alcoholic drinks
£1,568
Clothing and
footwear
£390
Alcohol and
tobacco
£291
Communication
£352
Restaurants
and hotel
£810
Bills
£1,303
Recreation
and culture
£1,595
Housing and
utilities
£1,680
A regular annual income
of similar amounts
23%
Take it as one lump sum
31%
Take several smaller
lump sums
46%
What 55+ savers plan to do with their retirement funds
Respondents could choose more than one
Holiday home 4%
Spending intentions of 55 to 75-year-olds under new pension freedoms
5%
43%
less than
£2,000
37%
15%
over
£10,000
£5,000-
£10,000
£2,000-
£5,000
And how much do they plan to splash out on a holiday

General living expenses 29%
Re-invest in ISA’s 23%
Holiday 19%
Home improvements 18%
Undecided 18%
Pay off mortgage 14%
Give to family/children 10%
New car 10%
Buy to let property 7%
Gross income per week
at 2010-2011 prices
Other investments
Occupational pension
Personal pension
Earnings and other income
Benefit (incl. state pension)
£
£27,000
Average amount savers plan to withdraws
in a lump sum from their retirement fund in 2015/16
£296
£610
£424
£202
2011
1994
2011
1994
Single
pensioners
Pensioner
couples
Average pensioner income
What pensioners spend their money on each year
Household
goods and
services
£862
Transport
£1,240
Personal
care
£897
Total
£11,200
Health
£212
Food and non-
alcoholic drinks
£1,568
Clothing and
footwear
£390
Alcohol and
tobacco
£291
Communication
£352
Restaurants
and hotel
£810
Bills
£1,303
Recreation
and culture
£1,595
Housing and
utilities
£1,680
Where do pensioners get their money?
Women
Men
Couples
A regular annual income
of similar amounts
23%
Take it as one lump sum
31%
Take several smaller
lump sums
46%
What 55+ savers plan to do with their retirement funds
Respondents could choose more than one
Holiday home 4%
Spending intentions of 55 to 75-year-olds under new pension freedoms
5%
43%
less than
£2,000
37%
15%
over
£10,000
£5,000-
£10,000
£2,000-
£5,000
And how much do they plan to splash out on a holiday

Gross income per week at
2010-2011 prices
General living expenses 29%
Re-invest in ISA’s 23%
Holiday 19%
Home improvements 18%
Pay off mortgage 14%
Give to family/children 10%
New car 10%
Buy to let property 7%
Undecided 18%
£
£27,000
Average amount savers plan to withdraw in a lump sum from their retirement fund in 2015/16
£296
£610
£424
£202
2011
1994
2011
1994
Single
pensioners
Pensioner
couples
Average pensioner income
What pensioners spend their money on each year
Household goods
and services
£862
Transport
£1,240
Personal care
£897
Total
£11,200
Health
£212
Food and non-
alcoholic drinks
£1,568
Clothing and
footwear
£390
Alcohol and
tobacco
£291
Communication
£352
Restaurants
and hotel
£810
Bills
£1,303
Recreation and
culture
£1,595
Housing and utilities
£1,680
Other investments
Occupational pension
Personal pension
Earnings and other income
Benefit (incl. state pension)
Where do pensioners get their money?
Women
Men
Couples
A regular annual income of
similar amounts
23%
Take it as one lump sum
31%
Take several smaller
lump sums
46%
What 55+ savers plan to do with their retirement funds
Respondents could choose more than one
Holiday home 4%
Spending intentions of 55 to 75-year-olds under new pension freedoms
5%
43%
less than £2,000
37%
15%
over £10,000
£5,000- £10,000
£2,000- £5,000
And how much do they plan to splash out on a holiday